Sample Solution
MST-015 Solved Assignment 2025
Question:-01
- Attempt the following:
(a) Write the output of the following statements:
(i)
(ii)
Answer:
(a) Write the output of the following statements:
(i)
In R, this statement would replicate the elements of the vector
times argument The output would be a logical vector:
(ii)
In R,
5 %% 3 would calculate the remainder of 5 divided by 3, which is 2.The
diag(3) would create a 3×3 identity matrix.The output would be:
[1] 2
     [,1] [,2] [,3]
[1,]    1    0    0
[2,]    0    1    0
[3,]    0    0    1
(b) Differentiate between the use of the sep and collapse arguments of the paste() function.
Answer:
In R, the
paste() function is used for concatenating strings. The sep and collapse arguments serve different purposes within this function:sep Argument:
The
sep argument specifies the string that separates the elements to be concatenated. It is used to separate multiple pieces of text that you are joining together.For example:
paste("Hello", "World", sep = " ")
Output:
"Hello World"Here, the
sep argument puts a space between "Hello" and "World".collapse Argument:
The
collapse argument is used when you have a vector of strings that you want to collapse into a single string. It specifies the separator between elements within the resulting single string.For example:
paste(c("Hello", "World"), collapse = " ")
Output:
"Hello World"Here, the
collapse argument collapses the vector c("Hello", "World") into a single string, separating the elements by a space.Key Differences:
sepis used to separate the elements that are being concatenated in a single call topaste().collapseis used to collapse a vector of strings into a single string.sepworks between the elements in each function call, whereascollapseworks on the entire vector to produce a single string.
Here’s an example that uses both
sep and collapse:paste(c("Hello", "World"), c("How", "are", "you"), sep = "-", collapse = " ")
Output:
"Hello-How World-are Hello-you"In this example,
sep = "-" puts a hyphen between elements being concatenated ("Hello" with "How", "World" with "are", and so on). Then collapse = " " collapses the resulting vector into a single string, separating each element by a space.(c) Write R commands to create a bar plot of the following data by using arguments of the used function for filling up the bars and to give labels to the axis:
Answer:
To fill the bars with a specific color and label the axes, you can use the
To fill the bars with a specific color and label the axes, you can use the
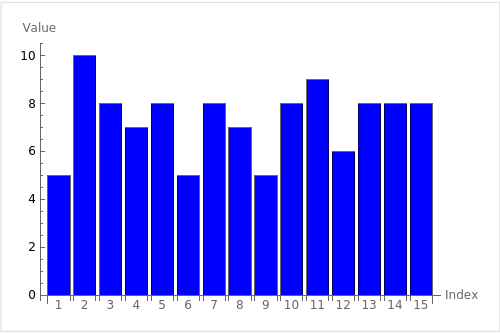
col and xlab/ylab arguments, respectively.Here’s an example R command to create a bar plot for the given data:
# Given data
data <- c(5, 10, 8, 7, 8, 5, 8, 7, 5, 8, 9, 6, 8, 8, 8)

# Create bar plot
barplot(data,
        col = "blue",  # Fill color for bars
        xlab = "Index",  # Label for x-axis
        ylab = "Value"  # Label for y-axis
)
In this example, the bars are filled with the color blue. The x-axis is labeled as "Index" and the y-axis is labeled as "Value".
Here’s how the bar plot would look like when generated:
(d) Check whether the given loop is finite or infinite. If infinite, do the necessary changes in the written loop to make it finite.
repeat {
if
repeat {
if
Answer:
The given loop is infinite because there is no
break statement to exit the loop. The if (x < 5) print(x) condition will only print the value of x when it is less than 5, but it won’t stop the loop from running indefinitely.To make the loop finite, we can add a
break statement with a condition to exit the loop. For example, you can break the loop when x reaches 5:x <- 0
repeat {
print(x^2)
x <- x + 1
if (x < 5) {
print(x)
} else {
break
}
}
In this modified version, the loop will terminate when
x becomes 5, making it a finite loop.