Get ahead in your IGNOU PGDAST Course studies with confidence by reviewing the MST-002 assignment questions before buying the expert-written solution from our app. Quick Search Section in our app makes it easy to double-check the year and session validity of the IGNOU assignment solutions, ensuring that you avoid any confusion. Our aim is to provide you with the most accurate and up-to-date IGNOU assignment solutions for PGDAST, and our expert-written assignments are unmatched by any other website. So, before making your purchase, take a moment to review the MST-002 assignment questions and ensure they match your needs. With our attention to detail and expertise, you can trust that you’re getting the right IGNOU assignment solution for your specific needs.
1. State whether the following statements are True or False and also give the reason in support of your answer.
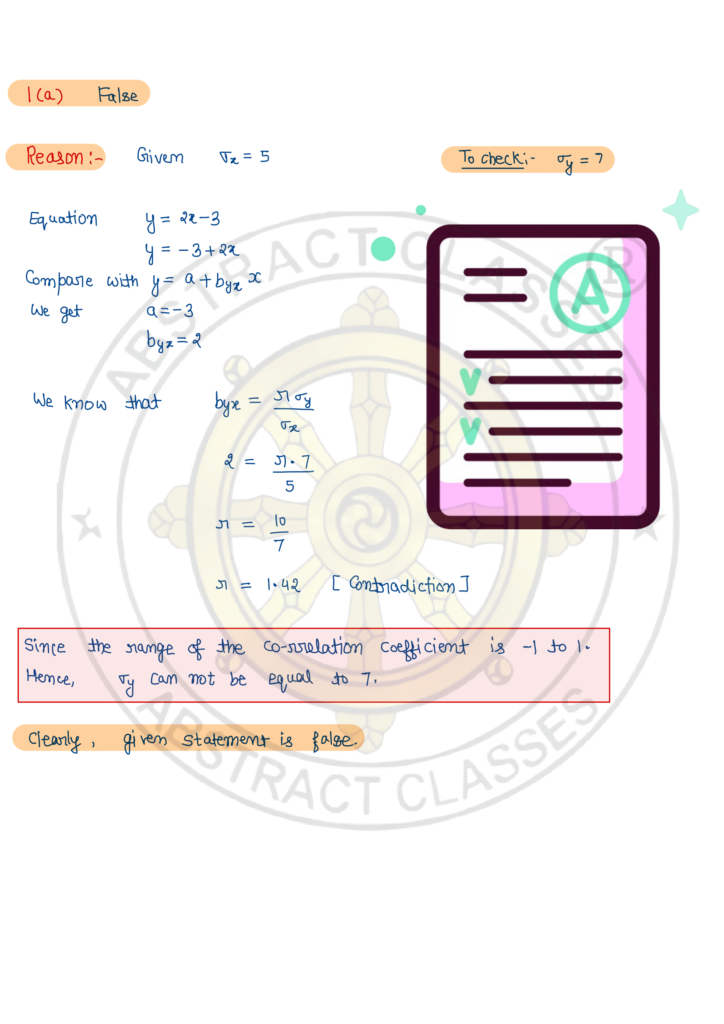
a) If standard deviation of \(x\) is 5 , standard deviation of \(y=2 x-3\) is 7 .
b) Mean deviation is least when calculated from the median.
c) The correlation coefficient between \(\mathrm{x}\) and \((a-\mathrm{x})\) is \(-1\).
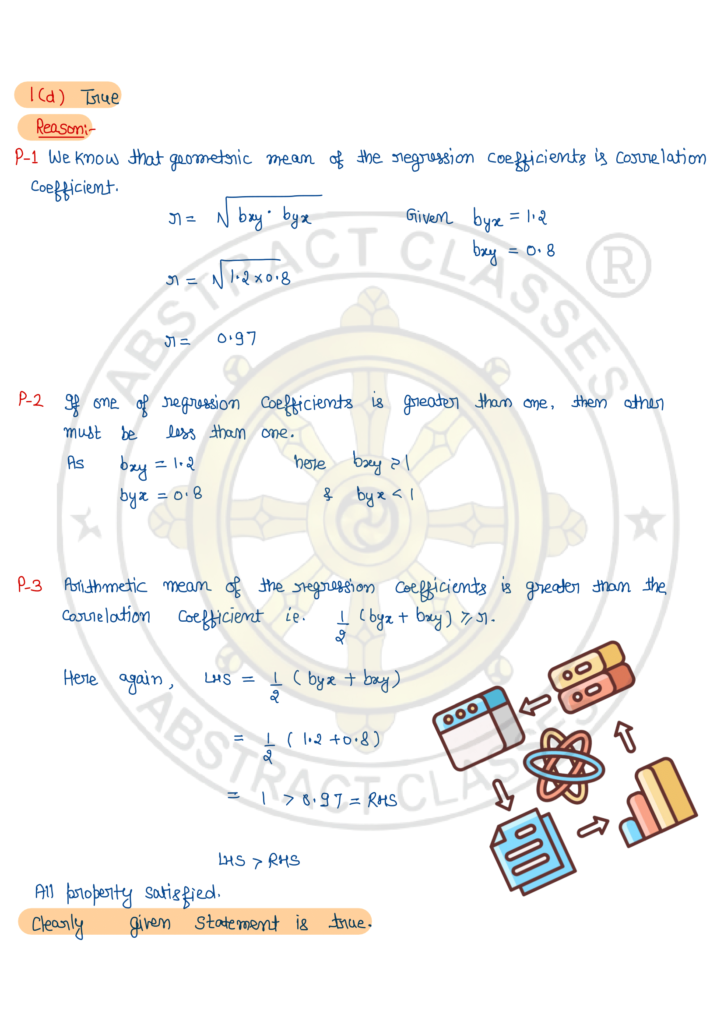
d) The regression coefficients \(b_{y x}\) and \(b_{x y}\) of a data are \(1.2\) and \(0.8\), respectively.
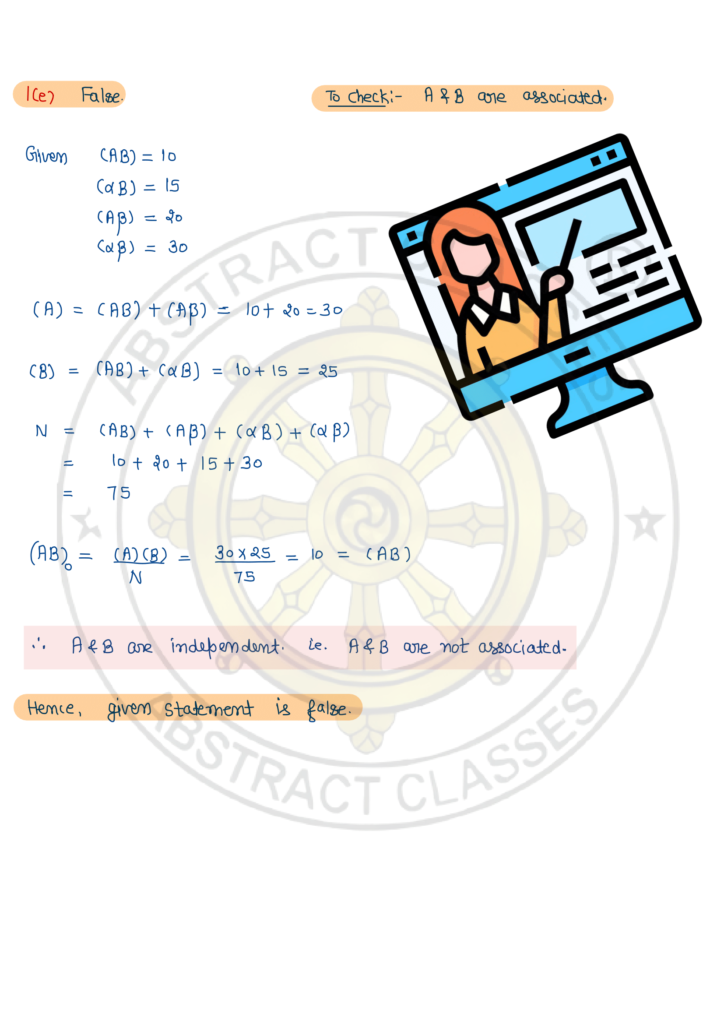
e) If \((\mathrm{AB})=10,(\alpha \mathrm{B})=15,(\mathrm{~A} \beta)=20\) and \((\alpha \beta)=30\) then \(\mathrm{A}\) and \(\mathrm{B}\) are associated.
2. a) Find the missing information from the following data:
\(\begin{array}{lcccl} & \text { Group I } & \text { Group II } & \text { Group III } & \text { Combined } \\ \text { Number } & 50 & ? & 90 & 200 \\ \text { Standard Deviation } & 6 & 7 & ? & 7.746 \\ \text { Mean } & 113 & ? & 115 & 116\end{array}\)
b) If AM and GM of two numbers are 30 and 18, respectively, find the numbers.
3. a) The frequency distribution of the marks obtained by the 25 students each of the two sections is given as follows:
\(\begin{array}{llllll}\text { Marks: } & 10-20 & 20-30 & 30-40 & 40-50 & 50-60 \\ \text { Section A: } & 2 & 5 & 10 & 5 & 3 \\ \text { Section B: } & 3 & 7 & 8 & 5 & 2\end{array}\)
Find which section is more consistent.
b) Mean and Standard deviation of 18 observations are found to be 7 and 4, respectively. On comparing the original data, it was found that an observation 12 was miscopied as 21 in the calculations. Calculate correct mean and standard deviation.
4. The equations of two regression lines are given as follows:
\[
\begin{aligned}
& 4 x-5 y+30=0 \\
& 20 x-9 y-107=0
\end{aligned}
\]
Calculate (i) regression coefficients, \(b_{y x}\) and \(b_{x y}\); (ii) correlation coefficient \(r(x, y)\); (iii) Mean of \(X\) and \(Y\); and (iv) the value of \(\sigma_{y}\) if \(\sigma_{x}=3\).
5. A researcher collects the following information for two variables \(\mathrm{x}\) and \(\mathrm{y}\) : \(\mathrm{n}=20, \mathrm{r}=0.5, \operatorname{mean}(\mathrm{x})=15\), mean \((\mathrm{y})=20, \sigma_{\mathrm{x}}=4\) and \(\sigma_{\mathrm{y}}=5\)
Later it was found that one pair of values \((\mathrm{x}, \mathrm{y})\) has been wrongly taken as \((16,30)\) whereas the correct values were \((26,35)\). Find the correct value of \(r(x, y)\). 6. a) If a, b, c, \(d\) are constants, then show that the coefficient of correlation between \(a x+b\) and \(c y+d\) is numerically equal to that between \(x\) and \(y\).
b) A statistician wanted to compare two methods A and B of teaching. He selected a random sample of 22 students. He grouped them into 11 pairs so that the students in pair have approximately equal scores on an intelligence test. In each pair one student was taught by method A and the other by method B and examined after the course. The marks obtained by both methods are given as:
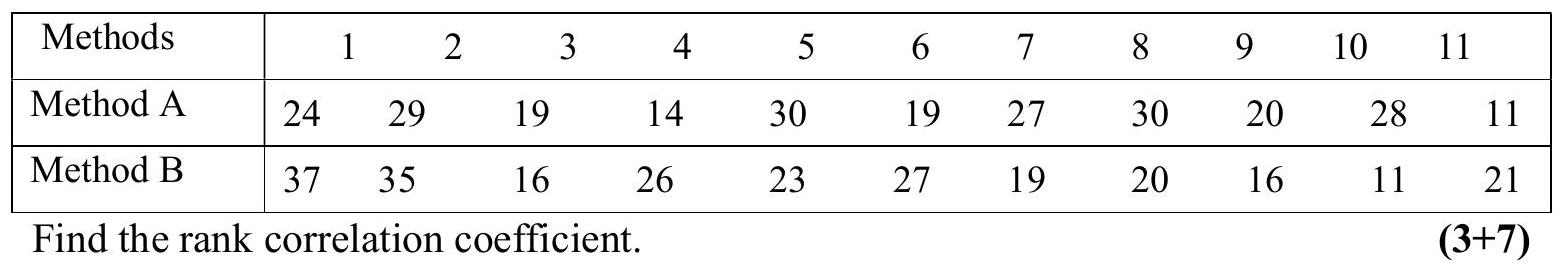
7. a) Fit an exponential curve of the form \(\mathrm{Y}=\mathrm{ab}^{\mathrm{X}}\) to the following data:
\(\begin{array}{lllllllll}\mathrm{X}: & 1 & 2 & 3 & 4 & 5 & 6 & 7 & 8\end{array}\)
\(\begin{array}{lllllllll}\mathrm{Y}: & 1.0 & 1.2 & 1.8 & 2.5 & 3.6 & 4.7 & 6.6 & 9.1\end{array}\)
b) Calculate the first, second and third quartile for the following data:
\(\begin{array}{lllllllll}\text { Class: } & \text { Below } 30 & 30-40 & 40-50 & 50-60 & 60-70 & 70-80 & 80 \text { and above }\end{array}\)
\(\begin{array}{llllllll}\text { Frequency: } & 69 & 167 & 207 & 65 & 58 & 27 & 10\end{array}\)
Also find the quartile deviation and coefficient of quartile deviation.
8. a) Board of Directors of Labour Union wishes to sample the opinion of its members before submitting a change in its contribution at a forthcoming annual meeting. Questionnaires are sent to a random sample of 200 members in three union locals. The results of the survey are as follows:
| Union Locals | ||||
| Reaction | A | B | C | Total |
| Favour Change | 35 | 45 | 20 | 100 |
| Against Change | 15 | 25 | 16 | 56 |
| No Response | 10 | 10 | 24 | 44 |
| Total | 60 | 80 | 60 | 200 |
Determine the amount of association between the Union locals and their reactions using coefficient of contingency and interpret the result.
b) 600 candidates were appeared in an examination. The boys outnumbered girls by \(15 \%\) of all candidates. Number of passed exceeded the number of failed candidates by 300 . Boys failing in the examination numbered 80. Determine the coefficient of association.