ONR-02 Solved Assignment 2025
- Explain different forms of Precipitations. Distinguish between convective and cyclonic rainfall along with diagram.
- Explain different types of recording and non-recording rain gauge.
- What is water balancing? Explain water budget with neat schematic diagram and write its different components.
- Calculate the average rainfall using the Thiessen polygon method from a 500 km² area using the given data:
- Stations: 1, 2, 3, 4, 5
- Rainfall (mm): 105, 200, 415, 325, 310
- Area of Polygon (km²): 75, 120, 100, 130, 75
- Define disinfection. Explain conventional water treatment plant along with flow diagram.
Answer:
Question:-1
Explain different forms of Precipitations. Distinguish between convective and cyclonic rainfall along with diagram.
Answer:
1. Introduction to Precipitation
Precipitation is a vital component of the hydrological cycle, representing the process by which water falls from the atmosphere to the Earth’s surface in various forms. It includes rain, snow, sleet, hail, and other forms, influenced by atmospheric conditions such as temperature, humidity, and pressure. Understanding the different forms of precipitation is essential for meteorology, agriculture, and water resource management. This comprehensive solution explores the various types of precipitation, with a detailed comparison between convective and cyclonic rainfall, including conceptual diagrams to illustrate their mechanisms.
2. Overview of Different Forms of Precipitation
Precipitation occurs when water vapor in the atmosphere condenses and falls due to gravity. The form it takes depends on atmospheric temperature and the altitude at which condensation occurs. Rain is liquid water droplets falling when temperatures are above freezing. Snow forms when water vapor turns directly into ice crystals in subfreezing conditions. Sleet consists of small ice pellets resulting from rain freezing as it falls through a cold layer. Hail involves larger ice balls formed in strong updrafts within thunderstorms, growing by layering. Drizzle is fine, light rain with small droplet sizes, often associated with stable air. Each form has unique characteristics and impacts, affecting ecosystems and human activities differently.
3. Detailed Explanation of Precipitation Types
The diversity in precipitation types arises from varying meteorological processes. Rain is the most common, occurring in warm or temperate climates, measured by rain gauges. Snow predominates in cold regions, accumulating as a water equivalent for meltwater estimates. Sleet and hail are less frequent, with sleet forming in transitional temperature zones and hail requiring intense convective activity. Drizzle occurs in stratus clouds with minimal vertical motion. Other rare forms include glaze (freezing rain coating surfaces) and rime (ice from supercooled droplets freezing on contact). These variations influence weather patterns and require specific measurement techniques.
4. Convective Rainfall: Mechanism and Characteristics
Convective rainfall results from the heating of the Earth’s surface, causing warm, moist air to rise due to convection. As the air ascends, it cools, condenses, and forms cumulonimbus clouds, leading to intense, localized showers or thunderstorms. This type is common in tropical and equatorial regions, especially during afternoons when solar heating peaks. Characteristics include high intensity, short duration, and significant spatial variability. It often occurs in summer, with rainfall amounts varying widely within short distances.
Diagram for Convective Rainfall:
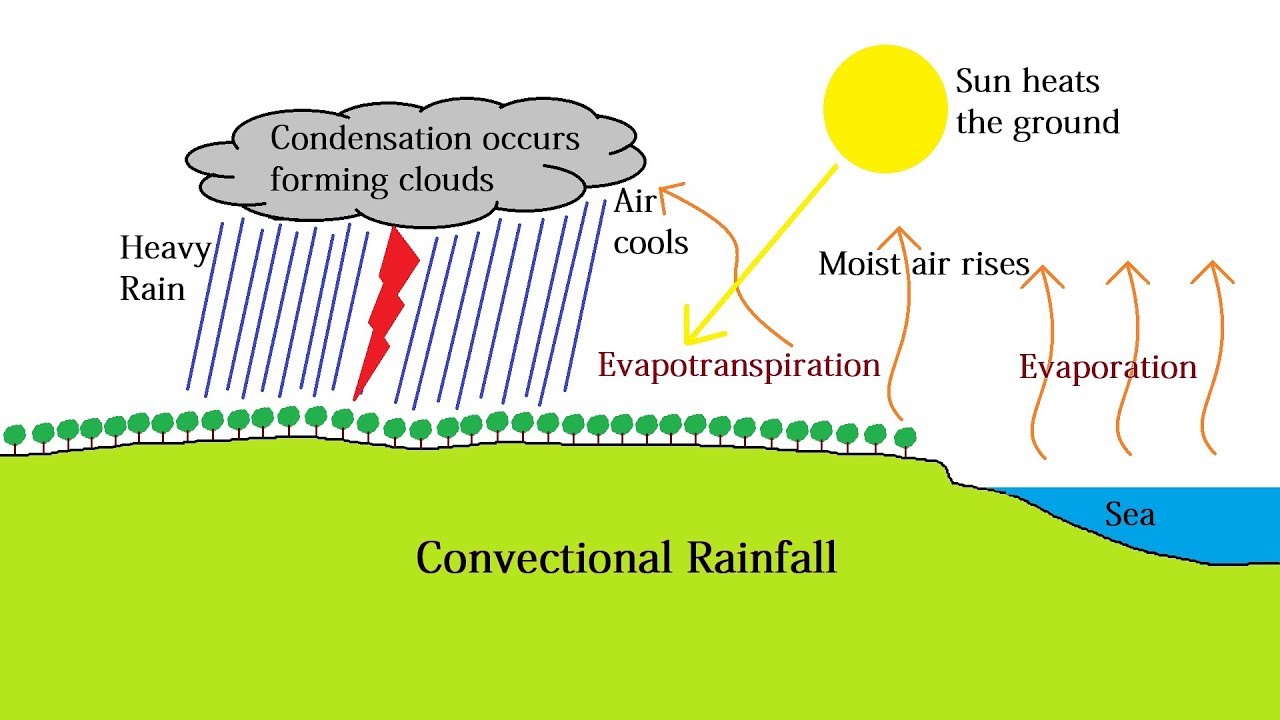
This diagram illustrates the vertical movement and rapid precipitation typical of convective systems.
5. Cyclonic Rainfall: Mechanism and Characteristics
Cyclonic rainfall occurs along weather fronts within low-pressure systems or cyclones, where warm and cold air masses meet. The warmer, moist air is forced upward over the colder air, leading to condensation and precipitation. This type is prevalent in temperate regions and associated with frontal systems or depressions. It features moderate to heavy rainfall, longer duration, and widespread coverage compared to convective rainfall. It is common in winter or during monsoon seasons influenced by cyclonic activity.
Diagram for Cyclonic Rainfall:
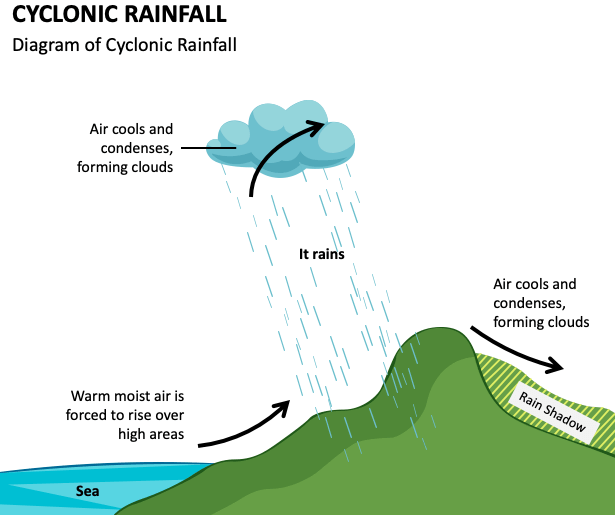
This diagram highlights the frontal lifting and extended precipitation pattern of cyclonic systems.
6. Distinction Between Convective and Cyclonic Rainfall
Convective and cyclonic rainfall differ in their formation, intensity, and geographic distribution. Convective rainfall is driven by thermal convection, producing intense, short-lived downpours in hot climates, whereas cyclonic rainfall results from frontal lifting, offering steady, prolonged rain over larger areas. Intensity is higher in convective events (e.g., 20-50 mm/hour), while cyclonic rainfall is gentler (e.g., 5-10 mm/hour). Spatially, convective rain is localized, often affecting 10-50 km², while cyclonic rain covers hundreds of kilometers. Seasonally, convective rainfall dominates summer, and cyclonic rainfall is more common in winter or transitional seasons.
7. Practical Implications and Measurement
Convective rainfall poses risks like flash floods due to its intensity, requiring robust drainage systems. Cyclonic rainfall supports agriculture through consistent water supply but can lead to prolonged flooding. Measurement involves rain gauges, with tipping bucket gauges suited for convective intensity and standard gauges for cyclonic totals. Accurate data aids in flood forecasting and irrigation planning, highlighting the need to distinguish these types for effective water management.
Conclusion
The diverse forms of precipitation, from rain to hail, reflect the complexity of atmospheric processes. Convective and cyclonic rainfall, though both significant, serve distinct roles in weather patterns, with their diagrams underscoring the contrasting mechanisms. Recognizing these differences enhances meteorological predictions and resource planning, ensuring better adaptation to varying climatic conditions.
Question:-2
Explain different types of recording and non-recording rain gauge.
Answer:
1. Introduction to Rain Gauges
Rain gauges are essential meteorological instruments used to measure the amount of precipitation over a specific period. They play a critical role in weather forecasting, agricultural planning, and water resource management. Rain gauges are categorized into two primary types: recording and non-recording. Each type has distinct mechanisms and applications, making them suitable for different environmental conditions and data collection needs. This comprehensive solution explores the definitions, working principles, advantages, and limitations of both recording and non-recording rain gauges, providing a detailed understanding of their functionality.
2. Overview of Non-Recording Rain Gauges
Non-recording rain gauges, also known as standard or manual rain gauges, measure the total rainfall accumulated over a given time without providing a continuous record. The most common design consists of a cylindrical container with a funnel that directs rainwater into a graduated measuring tube. The inner tube typically has a cross-sectional area ten times smaller than the collector, amplifying the measurement scale for precision. After rainfall, an observer manually reads the water level and resets the gauge.
The simplicity of non-recording rain gauges makes them cost-effective and easy to maintain. They are widely used in remote areas where continuous monitoring is not feasible. However, their primary limitation is the need for manual intervention, which can lead to human error or missed readings during unmonitored periods. Examples include the Symons rain gauge and the U.S. Weather Bureau gauge, both of which require daily or periodic checks.
3. Types of Non-Recording Rain Gauges
Several variations of non-recording rain gauges exist, tailored to specific needs. The Standard Rain Gauge features a simple funnel and graduated cylinder, ideal for basic measurements. The Tipping Bucket Rain Gauge, though often automated, can function manually in some designs, where tips are counted post-rainfall. Another type is the Weighing-Type Gauge in manual mode, where the weight of collected water is measured after the event. These types differ in construction and accuracy, with the standard gauge being the most prevalent due to its straightforward design and reliability in moderate rainfall conditions.
4. Overview of Recording Rain Gauges
Recording rain gauges automatically measure and record rainfall data over time, providing a continuous dataset. These instruments are equipped with mechanisms to log precipitation intensity and duration, making them invaluable for detailed meteorological analysis. The Tipping Bucket Rain Gauge is a popular type, where a bucket tips when filled with a specific volume of water, triggering a count or data log. Another example is the Weighing Rain Gauge, which measures the weight of accumulated water using a balance or spring mechanism, often linked to a chart recorder.
The advantage of recording rain gauges lies in their ability to provide real-time data, reducing the need for manual observation. They are extensively used in urban areas, research stations, and automated weather networks. However, they are more expensive and require regular maintenance to ensure mechanical components function correctly. Power supply issues and sensor malfunctions can also pose challenges.
5. Types of Recording Rain Gauges
Recording rain gauges come in several advanced forms. The Tipping Bucket Rain Gauge operates with two small buckets that alternate tipping, sending electrical signals to a data logger for each tip, corresponding to a fixed rainfall amount (e.g., 0.2 mm). The Weighing Rain Gauge uses a precision scale to measure water weight, often recording data on a graph or digitally, offering high accuracy for long-term studies. The Natural Siphon Rain Gauge features a siphon mechanism that empties the collector after reaching a set level, ensuring continuous recording. These types vary in complexity and application, with tipping bucket gauges being common in automated systems due to their reliability.
6. Comparison of Recording and Non-Recording Rain Gauges
Recording and non-recording rain gauges differ significantly in functionality and application. Non-recording gauges are simpler and cheaper but lack the ability to provide continuous data, making them less suitable for dynamic weather analysis. Recording gauges, while more costly and complex, offer detailed temporal data, essential for flood forecasting and climate studies. The choice between them depends on budget, location, and the level of data detail required. Non-recording gauges are sufficient for basic agricultural use, whereas recording gauges are preferred in scientific research and urban planning.
7. Practical Applications and Limitations
Non-recording rain gauges are ideal for rural settings where manual data collection is viable, supporting local farming decisions. However, their data is limited to total precipitation, missing intensity patterns. Recording rain gauges excel in urban flood management and climate modeling due to their continuous data, but their high cost and maintenance needs can be limiting factors. Environmental factors like wind, evaporation, and debris can affect both types, necessitating proper installation and calibration.
Conclusion
Understanding the differences between recording and non-recording rain gauges is crucial for selecting the appropriate tool for precipitation measurement. Non-recording gauges offer a practical solution for basic needs, while recording gauges provide advanced insights for complex applications. The choice hinges on the specific requirements of accuracy, automation, and resource availability, ensuring effective utilization in diverse meteorological contexts.
Question:-3
What is water balancing? Explain water budget with neat schematic diagram and write its different components.
Answer:
1. Introduction to Water Balancing
Water balancing is a critical concept in hydrology and water resource management, focusing on the systematic analysis of water inflow, outflow, and storage within a defined system over a specific period. It ensures the sustainable use and conservation of water by maintaining equilibrium between available water and its utilization. This process is essential for agricultural planning, urban water supply, and environmental protection. This comprehensive solution delves into the principles of water balancing, provides a detailed explanation of the water budget, includes a schematic diagram, and outlines its key components.
2. Understanding Water Balancing
Water balancing involves assessing the quantitative aspects of water in a given area, such as a watershed, reservoir, or irrigation system. It tracks the movement of water through precipitation, evaporation, runoff, and groundwater recharge to ensure that the system does not experience deficits or surpluses that could lead to drought or flooding. The process requires accurate data collection from rain gauges, streamflow measurements, and soil moisture sensors. Water balancing is widely applied in irrigation management, flood control, and drought mitigation, helping stakeholders make informed decisions based on real-time or historical data.
3. Concept of Water Budget
A water budget is a systematic account of the water balance within a hydrological system, representing the relationship between inputs (e.g., precipitation), outputs (e.g., evapotranspiration), and changes in storage (e.g., soil moisture or groundwater). It follows the principle of conservation of mass, where the total inflow minus the total outflow equals the change in storage over a period. The water budget is expressed as:
where
4. Schematic Diagram of Water Budget
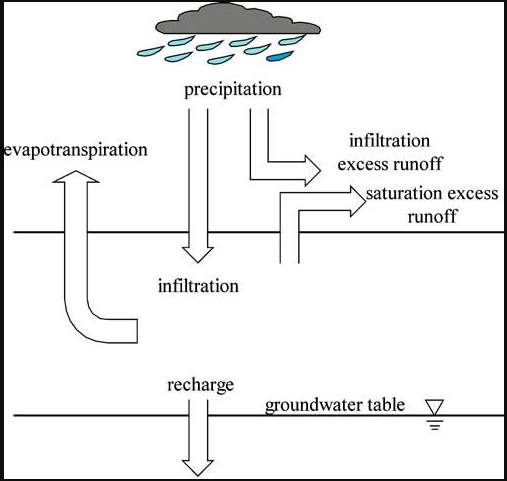
5. Components of Water Budget
The water budget comprises several key components, each playing a distinct role in the hydrological cycle:
- Precipitation (P): The primary input, including rain, snow, or hail, measured using rain gauges. It initiates the water cycle in a region.
- Inflow (I): Water entering the system from external sources, such as rivers or streams flowing into the watershed.
- Evaporation (E): The process where water changes from liquid to vapor from open surfaces like lakes or soil, driven by solar energy.
- Transpiration (T): Water loss from plants through stomata, often combined with evaporation as evapotranspiration in calculations.
- Runoff (R): Excess water that flows over the surface into streams, rivers, or oceans, influenced by soil saturation and slope.
- Change in Storage (ΔS): The net change in water held in soil moisture, groundwater, or surface reservoirs, reflecting the balance between inputs and outputs.
6. Importance and Application of Water Budget
The water budget is crucial for assessing water availability, planning irrigation schedules, and managing droughts or floods. It aids in designing reservoirs, predicting groundwater recharge, and ensuring sustainable agricultural practices. For instance, in arid regions, a negative
7. Challenges in Water Balancing and Budgeting
Challenges include data scarcity, especially in remote areas, and the variability of climatic factors like rainfall intensity. Evapotranspiration estimates can be imprecise due to vegetation cover changes, and human activities (e.g., dam construction) alter natural flows. Overcoming these requires advanced monitoring systems and regular updates to water budget models.
Conclusion
Water balancing and the water budget are foundational to managing Earth’s water resources effectively. The schematic diagram elucidates the dynamic interplay of its components, from precipitation to storage changes. By understanding and applying these principles, stakeholders can mitigate water scarcity, enhance agricultural productivity, and adapt to climatic variability, ensuring a balanced approach to water use in diverse ecosystems.
Question:-4
Calculate the average rainfall using the Thiessen polygon method from a 500 km² area using the given data:
- Stations: 1, 2, 3, 4, 5
- Rainfall (mm): 105, 200, 415, 325, 310
- Area of Polygon (km²): 75, 120, 100, 130, 75
Answer:
To calculate the average rainfall using the Thiessen polygon method, we need to determine the weighted average of the rainfall values based on the areas of the corresponding Thiessen polygons. The Thiessen polygon method assigns weights to each rain gauge station proportional to the area of the polygon surrounding it, reflecting the influence of that station’s rainfall on the total area.
Given Data:
- Stations: 1, 2, 3, 4, 5
- Rainfall (mm): 105, 200, 415, 325, 310
- Area of Polygon (km²): 75, 120, 100, 130, 75
- Total area = 500 km²
Step 1: Calculate the Weighted Rainfall
The weighted rainfall for each station is calculated by multiplying the rainfall at each station by the area of its corresponding Thiessen polygon. This reflects the contribution of each station’s rainfall to the total area.
- Station 1:
- Station 2:
- Station 3:
- Station 4:
- Station 5:
Step 2: Sum the Weighted Rainfall
Add the weighted rainfall values to get the total weighted rainfall:
Step 3: Calculate the Average Rainfall
The average rainfall is the total weighted rainfall divided by the total area:
Final Answer
The average rainfall over the 500 km² area, using the Thiessen polygon method, is 277.75 mm.
Question:-5
Define disinfection. Explain conventional water treatment plant along with flow diagram.
Answer:
1. Introduction to Disinfection
Disinfection is a critical process in water treatment aimed at eliminating or inactivating pathogenic microorganisms, such as bacteria, viruses, and protozoa, to ensure water is safe for human consumption and other uses. It is a key step in public health protection, preventing waterborne diseases like cholera and typhoid. Disinfection can be achieved through chemical methods (e.g., chlorination), physical methods (e.g., UV radiation), or a combination of both. This comprehensive solution defines disinfection in detail, outlines the conventional water treatment plant process, and includes a flow diagram to illustrate the treatment stages.
2. Definition and Importance of Disinfection
Disinfection refers to the selective destruction or inactivation of disease-causing microorganisms in water, without necessarily sterilizing it completely, which would eliminate all microbes. The goal is to reduce microbial content to levels deemed safe by health standards, such as those set by the World Health Organization (WHO) or national guidelines. It is essential because untreated water from natural sources often contains pathogens from human or animal waste. Effective disinfection enhances water quality, supports public health, and is a legal requirement in many regions, making it a cornerstone of potable water supply systems.
3. Overview of Conventional Water Treatment Plant
A conventional water treatment plant is designed to remove physical, chemical, and biological contaminants from raw water, typically sourced from rivers, lakes, or reservoirs. The process involves several stages: screening, coagulation, flocculation, sedimentation, filtration, and disinfection. Each stage targets specific impurities, transforming turbid, contaminated water into clear, safe drinking water. This method is widely used globally due to its reliability and ability to handle large volumes, though it requires significant infrastructure and maintenance. The final disinfection step ensures the water remains pathogen-free during distribution.
4. Detailed Process of Conventional Water Treatment
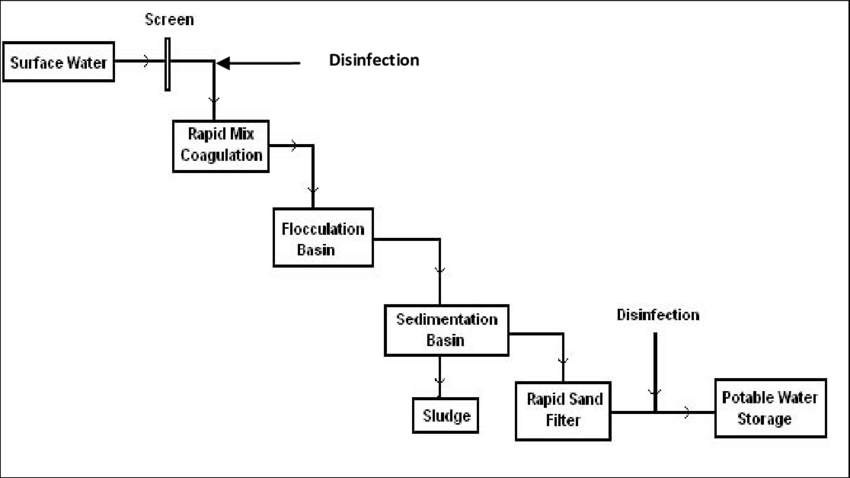
The conventional water treatment process begins with screening, where large debris like sticks and leaves are removed using bar screens. Coagulation follows, where chemicals (e.g., alum) are added to destabilize suspended particles, forming micro-flocs. In flocculation, gentle mixing encourages these particles to aggregate into larger floc. Sedimentation allows the floc to settle out of the water by gravity in sedimentation tanks. Filtration then removes remaining particles using sand or multimedia filters. Finally, disinfection (e.g., with chlorine or ozone) kills or inactivates pathogens. The treated water is stored and distributed, with residual disinfectants maintaining safety.
5. Flow Diagram of Conventional Water Treatment Plant
6. Types of Disinfection in Water Treatment
Disinfection methods vary based on technology and application. Chlorination uses chlorine gas or compounds to kill pathogens, leaving a residual effect, though it may form disinfection byproducts. Ozonation employs ozone gas for rapid microbial kill but lacks residual protection. Ultraviolet (UV) radiation disrupts microbial DNA, effective for clear water but requires pre-filtration. Chlorine dioxide and electrochemical disinfection are alternatives with specific advantages, such as reduced byproduct formation. The choice depends on water quality, cost, and regulatory requirements.
7. Challenges and Considerations in Disinfection
Challenges include ensuring complete pathogen removal, managing chemical residuals, and addressing resistant microorganisms. Over-dosing disinfectants can produce harmful byproducts like trihalomethanes, while under-dosing risks disease outbreaks. Regular monitoring, proper dosing, and advanced treatment (e.g., activated carbon) are needed. Additionally, aging infrastructure and power disruptions can affect treatment efficiency, necessitating robust maintenance and backup systems.
Conclusion
Disinfection is a vital safeguard in water treatment, ensuring pathogen-free water for public use. The conventional water treatment plant, with its multi-stage process and flow diagram, exemplifies a structured approach to water purification. By addressing challenges and optimizing disinfection methods, water treatment plants can effectively meet the growing demand for safe drinking water, supporting health and sustainability in communities worldwide.
ONR-02 हल किया गया असाइनमेंट 2025
- वर्षा के विभिन्न रूपों की व्याख्या कीजिए। संवहनीय और चक्रवातीय वर्षा में अंतर स्पष्ट कीजिए तथा चित्र भी बनाइए।
- विभिन्न प्रकार के रिकॉर्डिंग और गैर-रिकॉर्डिंग वर्षामापी की व्याख्या करें।
- जल संतुलन क्या है? जल बजट को एक स्पष्ट योजनाबद्ध आरेख द्वारा समझाइए तथा इसके विभिन्न घटकों के नाम लिखिए।
- दिए गए डेटा का उपयोग करके 500 वर्ग किमी क्षेत्र से थिएसेन बहुभुज विधि का उपयोग करके औसत वर्षा की गणना करें:
- स्टेशन: 1, 2, 3, 4, 5
- वर्षा (मिमी): 105, 200, 415, 325, 310
- बहुभुज का क्षेत्रफल (किमी²): 75, 120, 100, 130, 75
- कीटाणुशोधन को परिभाषित कीजिए। प्रवाह आरेख सहित पारंपरिक जल उपचार संयंत्र की व्याख्या कीजिए।
उत्तर:
प्रश्न:-1
वर्षा के विभिन्न रूपों की व्याख्या कीजिए। संवहनीय और चक्रवातीय वर्षा में अंतर स्पष्ट कीजिए तथा चित्र भी बनाइए।
उत्तर:
1. वर्षा का परिचय
वर्षा जल विज्ञान चक्र का एक महत्वपूर्ण घटक है, जो उस प्रक्रिया का प्रतिनिधित्व करता है जिसके द्वारा जल विभिन्न रूपों में वायुमंडल से पृथ्वी की सतह पर गिरता है। इसमें वर्षा, हिमपात, ओले, ओले और अन्य रूप शामिल हैं, जो तापमान, आर्द्रता और दबाव जैसी वायुमंडलीय स्थितियों से प्रभावित होते हैं। वर्षा के विभिन्न रूपों को समझना मौसम विज्ञान, कृषि और जल संसाधन प्रबंधन के लिए आवश्यक है। यह व्यापक समाधान विभिन्न प्रकार की वर्षा का अन्वेषण करता है, जिसमें संवहनीय और चक्रवातीय वर्षा के बीच विस्तृत तुलना, और उनकी क्रियाविधि को दर्शाने वाले संकल्पनात्मक आरेख शामिल हैं।
2. वर्षा के विभिन्न रूपों का अवलोकन
वर्षा तब होती है जब वायुमंडल में मौजूद जलवाष्प गुरुत्वाकर्षण के कारण संघनित होकर गिरती है। इसका रूप वायुमंडलीय तापमान और संघनन की ऊँचाई पर निर्भर करता है। वर्षा तरल जल की बूँदें होती हैं जो तापमान शून्य से ऊपर होने पर गिरती हैं। हिम तब बनता है जब जलवाष्प शून्य से नीचे की स्थितियों में सीधे बर्फ के क्रिस्टल में बदल जाती है। ओले छोटे बर्फ के गोले होते हैं जो ठंडी परत से गिरते समय वर्षा के जमने से बनते हैं। ओलावृष्टि में गरज के साथ तेज़ हवा के झोंकों में बने बड़े बर्फ के गोले होते हैं, जो परतों में बढ़ते हैं। बूंदाबांदी छोटी बूंदों वाली हल्की, हल्की वर्षा होती है, जो अक्सर स्थिर हवा से जुड़ी होती है। प्रत्येक रूप की अपनी विशिष्ट विशेषताएँ और प्रभाव होते हैं, जो पारिस्थितिक तंत्र और मानवीय गतिविधियों को अलग-अलग तरीके से प्रभावित करते हैं।
3. वर्षा के प्रकारों का विस्तृत विवरण
वर्षा के प्रकारों में विविधता विभिन्न मौसम संबंधी प्रक्रियाओं के कारण उत्पन्न होती है। वर्षा सबसे आम है, जो गर्म या समशीतोष्ण जलवायु में होती है और वर्षामापी यंत्रों द्वारा मापी जाती है। ठंडे क्षेत्रों में हिमपात प्रमुख होता है, जो पिघले पानी के अनुमान के लिए जल के समतुल्य के रूप में जमा होता है। ओले और ओले कम बार पड़ते हैं, संक्रमणकालीन तापमान क्षेत्रों में ओले बनते हैं और ओले के लिए तीव्र संवहनीय क्रिया की आवश्यकता होती है। बूंदाबांदी न्यूनतम ऊर्ध्वाधर गति के साथ स्तरी बादलों में होती है। अन्य दुर्लभ रूपों में ग्लेज़ (बर्फ़ीली वर्षा की सतह पर परत) और राइम (संपर्क में आने पर जमने वाली अतिशीतित बूंदों से बनी बर्फ) शामिल हैं। ये विविधताएँ मौसम के स्वरूपों को प्रभावित करती हैं और इनके लिए विशिष्ट मापन तकनीकों की आवश्यकता होती है।
4. संवहनीय वर्षा: क्रियाविधि और विशेषताएँ
संवहनीय वर्षा पृथ्वी की सतह के गर्म होने के कारण होती है, जिससे संवहन के कारण गर्म, नम हवा ऊपर उठती है। जैसे-जैसे हवा ऊपर उठती है, वह ठंडी होकर संघनित होती है और क्यूम्यलोनिम्बस बादल बनाती है, जिससे तीव्र, स्थानीयकृत वर्षा या गरज के साथ बारिश होती है। यह प्रकार उष्णकटिबंधीय और भूमध्यरेखीय क्षेत्रों में आम है, खासकर दोपहर के समय जब सौर ताप चरम पर होता है। इसकी विशेषताओं में उच्च तीव्रता, कम अवधि और महत्वपूर्ण स्थानिक परिवर्तनशीलता शामिल हैं। यह अक्सर गर्मियों में होता है, और कम दूरी पर वर्षा की मात्रा में व्यापक अंतर होता है।
संवहनीय वर्षा के लिए आरेख:
यह आरेख संवहन प्रणालियों की ऊर्ध्वाधर गति और तीव्र वर्षा को दर्शाता है।
5. चक्रवाती वर्षा: तंत्र और विशेषताएं
चक्रवाती वर्षा निम्न-दाब प्रणालियों या चक्रवातों के भीतर मौसम के मोर्चों पर होती है, जहाँ गर्म और ठंडी वायुराशियाँ मिलती हैं। गर्म, नम हवाएँ ठंडी हवा के ऊपर ऊपर की ओर धकेली जाती हैं, जिससे संघनन और वर्षा होती है। यह प्रकार समशीतोष्ण क्षेत्रों में प्रचलित है और वाताग्रीय प्रणालियों या अवदाब से जुड़ा है। संवहनीय वर्षा की तुलना में इसमें मध्यम से भारी वर्षा, लंबी अवधि और व्यापक कवरेज होता है। यह सर्दियों में या चक्रवाती गतिविधि से प्रभावित मानसून के मौसम में आम है।
चक्रवाती वर्षा का आरेख:
यह आरेख चक्रवाती प्रणालियों के अग्रवर्ती उत्थान और विस्तारित वर्षा पैटर्न पर प्रकाश डालता है।
6. संवहनीय और चक्रवाती वर्षा के बीच अंतर
संवहनीय और चक्रवाती वर्षा उनके निर्माण, तीव्रता और भौगोलिक वितरण में भिन्न होती हैं। संवहनीय वर्षा ऊष्मीय संवहन द्वारा संचालित होती है, जिससे गर्म जलवायु में तीव्र, अल्पकालिक वर्षा होती है, जबकि चक्रवाती वर्षा वाताग्रीय उत्थान के परिणामस्वरूप होती है, जिससे बड़े क्षेत्रों में स्थिर, दीर्घकालिक वर्षा होती है। संवहनीय घटनाओं में तीव्रता अधिक होती है (जैसे, 20-50 मिमी/घंटा), जबकि चक्रवाती वर्षा कम होती है (जैसे, 5-10 मिमी/घंटा)। स्थानिक रूप से, संवहनीय वर्षा स्थानीय होती है, जो अक्सर 10-50 वर्ग किमी क्षेत्र को प्रभावित करती है, जबकि चक्रवाती वर्षा सैकड़ों किलोमीटर तक फैली होती है। मौसमी रूप से, संवहनीय वर्षा गर्मियों में अधिक होती है, और चक्रवाती वर्षा सर्दियों या संक्रमणकालीन ऋतुओं में अधिक आम है।
7. व्यावहारिक निहितार्थ और मापन
संवहनीय वर्षा अपनी तीव्रता के कारण अचानक बाढ़ जैसे जोखिम पैदा करती है, जिसके लिए मज़बूत जल निकासी प्रणालियों की आवश्यकता होती है। चक्रवाती वर्षा निरंतर जल आपूर्ति के माध्यम से कृषि को बढ़ावा देती है, लेकिन लंबे समय तक बाढ़ का कारण बन सकती है। मापन में वर्षामापी यंत्रों का उपयोग किया जाता है, जिनमें संवहनीय तीव्रता के लिए उपयुक्त टिपिंग बकेट गेज और चक्रवाती योग के लिए मानक गेज शामिल हैं। सटीक आँकड़े बाढ़ के पूर्वानुमान और सिंचाई योजना में सहायक होते हैं, जो प्रभावी जल प्रबंधन के लिए इन प्रकारों में अंतर करने की आवश्यकता पर प्रकाश डालता है।
निष्कर्ष
वर्षा से लेकर ओलावृष्टि तक, वर्षा के विविध रूप वायुमंडलीय प्रक्रियाओं की जटिलता को दर्शाते हैं। संवहनीय और चक्रवातीय वर्षा, दोनों ही महत्वपूर्ण होते हुए भी, मौसम के स्वरूपों में अलग-अलग भूमिकाएँ निभाती हैं, और उनके आरेख इनके विपरीत तंत्रों को रेखांकित करते हैं। इन अंतरों को पहचानने से मौसम संबंधी पूर्वानुमान और संसाधन नियोजन में सुधार होता है, जिससे बदलती जलवायु परिस्थितियों के लिए बेहतर अनुकूलन सुनिश्चित होता है।
प्रश्न:-2
विभिन्न प्रकार के रिकॉर्डिंग और गैर-रिकॉर्डिंग वर्षामापी की व्याख्या करें।
उत्तर:
1. वर्षामापी का परिचय
वर्षामापी आवश्यक मौसम संबंधी उपकरण हैं जिनका उपयोग किसी विशिष्ट अवधि में वर्षा की मात्रा मापने के लिए किया जाता है। ये मौसम पूर्वानुमान, कृषि नियोजन और जल संसाधन प्रबंधन में महत्वपूर्ण भूमिका निभाते हैं। वर्षामापी दो मुख्य प्रकारों में वर्गीकृत हैं: रिकॉर्डिंग और गैर-रिकॉर्डिंग। प्रत्येक प्रकार के अपने विशिष्ट तंत्र और अनुप्रयोग होते हैं, जो उन्हें विभिन्न पर्यावरणीय परिस्थितियों और डेटा संग्रह आवश्यकताओं के लिए उपयुक्त बनाते हैं। यह व्यापक समाधान रिकॉर्डिंग और गैर-रिकॉर्डिंग दोनों प्रकार के वर्षामापियों की परिभाषाओं, कार्य सिद्धांतों, लाभों और सीमाओं का अन्वेषण करता है, और उनकी कार्यक्षमता की विस्तृत समझ प्रदान करता है।
2. गैर-रिकॉर्डिंग वर्षामापी का अवलोकन
गैर-रिकॉर्डिंग वर्षामापी, जिन्हें मानक या मैनुअल वर्षामापी भी कहा जाता है, किसी निश्चित समय में हुई कुल वर्षा को बिना किसी निरंतर रिकॉर्ड के मापते हैं। सबसे आम डिज़ाइन में एक बेलनाकार कंटेनर होता है जिसमें एक फ़नल होता है जो वर्षा जल को एक अंशांकित मापन नली में निर्देशित करता है। आंतरिक नली का अनुप्रस्थ काट क्षेत्रफल आमतौर पर संग्राहक से दस गुना छोटा होता है, जो सटीकता के लिए माप पैमाने को बढ़ाता है। वर्षा के बाद, एक पर्यवेक्षक मैन्युअल रूप से जल स्तर को मापता है और गेज को रीसेट करता है।
गैर-रिकॉर्डिंग वर्षामापी उपकरणों की सरलता उन्हें लागत-प्रभावी और रखरखाव में आसान बनाती है। इनका व्यापक रूप से दूरदराज के इलाकों में उपयोग किया जाता है जहाँ निरंतर निगरानी संभव नहीं है। हालाँकि, उनकी मुख्य सीमा मैन्युअल हस्तक्षेप की आवश्यकता है, जिससे मानवीय त्रुटि हो सकती है या निगरानी न होने की अवधि के दौरान रीडिंग छूट सकती है। उदाहरणों में सिमंस वर्षामापी और अमेरिकी मौसम ब्यूरो गेज शामिल हैं, दोनों को दैनिक या आवधिक जाँच की आवश्यकता होती है।
3. गैर-रिकॉर्डिंग वर्षामापी के प्रकार
विशिष्ट आवश्यकताओं के अनुरूप, गैर-रिकॉर्डिंग वर्षामापी के कई प्रकार उपलब्ध हैं। मानक वर्षामापी में एक साधारण फ़नल और अंशांकित सिलेंडर होता है, जो बुनियादी मापों के लिए आदर्श है। टिपिंग बकेट वर्षामापी , हालाँकि अक्सर स्वचालित होता है, कुछ डिज़ाइनों में मैन्युअल रूप से भी काम कर सकता है, जहाँ वर्षा के बाद टिपों की गणना की जाती है। एक अन्य प्रकार का भार-प्रकार का गेज मैन्युअल रूप से काम करता है, जहाँ एकत्रित पानी का भार वर्षा के बाद मापा जाता है। ये प्रकार संरचना और सटीकता में भिन्न होते हैं, मानक गेज अपने सरल डिज़ाइन और मध्यम वर्षा की स्थिति में विश्वसनीयता के कारण सबसे अधिक प्रचलित है।
4. रिकॉर्डिंग वर्षामापी का अवलोकन
रिकॉर्डिंग रेन गेज स्वचालित रूप से समय के साथ वर्षा के आंकड़ों को मापते और रिकॉर्ड करते हैं, जिससे एक सतत डेटासेट मिलता है। ये उपकरण वर्षा की तीव्रता और अवधि को रिकॉर्ड करने की प्रणाली से लैस हैं, जो इन्हें विस्तृत मौसम संबंधी विश्लेषण के लिए अमूल्य बनाता है। टिपिंग बकेट रेन गेज एक लोकप्रिय प्रकार है, जिसमें एक बाल्टी एक निश्चित मात्रा में पानी भरने पर पलट जाती है, जिससे एक गिनती या डेटा लॉग शुरू हो जाता है। एक अन्य उदाहरण वेइंग रेन गेज है , जो एक तुला या स्प्रिंग तंत्र का उपयोग करके संचित पानी का भार मापता है, जिसे अक्सर एक चार्ट रिकॉर्डर से जोड़ा जाता है।
वर्षामापी यंत्रों का लाभ यह है कि वे वास्तविक समय के आँकड़े प्रदान करते हैं, जिससे मैन्युअल अवलोकन की आवश्यकता कम हो जाती है। शहरी क्षेत्रों, अनुसंधान केंद्रों और स्वचालित मौसम नेटवर्क में इनका व्यापक रूप से उपयोग किया जाता है। हालाँकि, ये अधिक महंगे होते हैं और यांत्रिक घटकों के सही ढंग से काम करने के लिए नियमित रखरखाव की आवश्यकता होती है। बिजली आपूर्ति संबंधी समस्याएँ और सेंसर की खराबी भी चुनौतियाँ पैदा कर सकती हैं।
5. वर्षा रिकॉर्डिंग गेज के प्रकार
वर्षा रिकॉर्डिंग गेज कई उन्नत रूपों में उपलब्ध हैं। टिपिंग बकेट रेन गेज दो छोटी बाल्टियों से संचालित होता है जो बारी-बारी से पलटती हैं और प्रत्येक टिप के लिए एक डेटा लॉगर को विद्युत संकेत भेजती हैं, जो एक निश्चित वर्षा मात्रा (जैसे, 0.2 मिमी) के अनुरूप होता है। वेइंग रेन गेज पानी के भार को मापने के लिए एक सटीक पैमाने का उपयोग करता है, जो अक्सर ग्राफ़ पर या डिजिटल रूप से डेटा रिकॉर्ड करता है, जिससे दीर्घकालिक अध्ययनों के लिए उच्च सटीकता मिलती है। प्राकृतिक साइफन रेन गेज में एक साइफन तंत्र होता है जो एक निर्धारित स्तर तक पहुँचने के बाद कलेक्टर को खाली कर देता है, जिससे निरंतर रिकॉर्डिंग सुनिश्चित होती है। ये प्रकार जटिलता और अनुप्रयोग में भिन्न होते हैं, टिपिंग बकेट गेज अपनी विश्वसनीयता के कारण स्वचालित प्रणालियों में आम हैं।
6. रिकॉर्डिंग और गैर-रिकॉर्डिंग वर्षामापी की तुलना
रिकॉर्डिंग और गैर-रिकॉर्डिंग वर्षामापी, कार्यक्षमता और अनुप्रयोग में काफ़ी भिन्न होते हैं। गैर-रिकॉर्डिंगमापी सरल और सस्ते होते हैं, लेकिन निरंतर आँकड़े प्रदान करने की क्षमता का अभाव रखते हैं, जिससे वे गतिशील मौसम विश्लेषण के लिए कम उपयुक्त होते हैं। रिकॉर्डिंगमापी, हालाँकि अधिक महंगे और जटिल होते हैं, विस्तृत अस्थायी आँकड़े प्रदान करते हैं, जो बाढ़ पूर्वानुमान और जलवायु अध्ययनों के लिए आवश्यक हैं। इनके बीच का चुनाव बजट, स्थान और आवश्यक आँकड़े के स्तर पर निर्भर करता है। गैर-रिकॉर्डिंगमापी बुनियादी कृषि उपयोग के लिए पर्याप्त हैं, जबकि वैज्ञानिक अनुसंधान और शहरी नियोजन में रिकॉर्डिंगमापी को प्राथमिकता दी जाती है।
7. व्यावहारिक अनुप्रयोग और सीमाएँ
गैर-रिकॉर्डिंग वर्षामापी ग्रामीण परिवेशों के लिए आदर्श हैं जहाँ मैन्युअल डेटा संग्रह संभव है और स्थानीय कृषि निर्णयों में सहायक होता है। हालाँकि, इनका डेटा कुल वर्षा तक सीमित होता है, और तीव्रता के पैटर्न गायब होते हैं। रिकॉर्डिंग वर्षामापी अपने निरंतर डेटा के कारण शहरी बाढ़ प्रबंधन और जलवायु मॉडलिंग में उत्कृष्ट हैं, लेकिन उनकी उच्च लागत और रखरखाव की ज़रूरतें सीमित कारक हो सकती हैं। हवा, वाष्पीकरण और मलबा जैसे पर्यावरणीय कारक दोनों प्रकारों को प्रभावित कर सकते हैं, जिसके लिए उचित स्थापना और अंशांकन आवश्यक है।
निष्कर्ष
वर्षा माप के लिए उपयुक्त उपकरण चुनने हेतु रिकॉर्डिंग और गैर-रिकॉर्डिंग वर्षामापी के बीच अंतर को समझना अत्यंत महत्वपूर्ण है। गैर-रिकॉर्डिंग गेज बुनियादी ज़रूरतों के लिए एक व्यावहारिक समाधान प्रदान करते हैं, जबकि रिकॉर्डिंग गेज जटिल अनुप्रयोगों के लिए उन्नत जानकारी प्रदान करते हैं। यह चुनाव सटीकता, स्वचालन और संसाधन उपलब्धता जैसी विशिष्ट आवश्यकताओं पर निर्भर करता है, जिससे विविध मौसम संबंधी संदर्भों में प्रभावी उपयोग सुनिश्चित होता है।
प्रश्न:-3
जल संतुलन क्या है? जल बजट को एक स्पष्ट योजनाबद्ध आरेख द्वारा समझाइए तथा इसके विभिन्न घटकों के नाम लिखिए।
उत्तर:
1. जल संतुलन का परिचय
जल संतुलन जल विज्ञान और जल संसाधन प्रबंधन में एक महत्वपूर्ण अवधारणा है, जो एक निश्चित अवधि में एक निश्चित प्रणाली के भीतर जल अंतर्वाह, बहिर्वाह और भंडारण के व्यवस्थित विश्लेषण पर केंद्रित है। यह उपलब्ध जल और उसके उपयोग के बीच संतुलन बनाए रखकर जल के सतत उपयोग और संरक्षण को सुनिश्चित करता है। यह प्रक्रिया कृषि नियोजन, शहरी जल आपूर्ति और पर्यावरण संरक्षण के लिए आवश्यक है। यह व्यापक समाधान जल संतुलन के सिद्धांतों पर गहनता से विचार करता है, जल बजट की विस्तृत व्याख्या प्रदान करता है, एक योजनाबद्ध आरेख शामिल करता है, और इसके प्रमुख घटकों की रूपरेखा प्रस्तुत करता है।
2. जल संतुलन को समझना
जल संतुलन में किसी दिए गए क्षेत्र, जैसे जलग्रहण क्षेत्र, जलाशय या सिंचाई प्रणाली, में जल के मात्रात्मक पहलुओं का आकलन शामिल होता है। यह वर्षा, वाष्पीकरण, अपवाह और भूजल पुनर्भरण के माध्यम से जल की गति पर नज़र रखता है ताकि यह सुनिश्चित किया जा सके कि प्रणाली में पानी की कमी या अधिकता न हो जिससे सूखा या बाढ़ आ सकती है। इस प्रक्रिया के लिए वर्षामापी, जलप्रवाह मापक और मृदा नमी संवेदकों से सटीक आँकड़े एकत्र करने की आवश्यकता होती है। जल संतुलन का व्यापक रूप से सिंचाई प्रबंधन, बाढ़ नियंत्रण और सूखा शमन में उपयोग किया जाता है, जिससे हितधारकों को वास्तविक समय या ऐतिहासिक आँकड़ों के आधार पर सूचित निर्णय लेने में मदद मिलती है।
3. जल बजट की अवधारणा
जल बजट, किसी जल विज्ञान प्रणाली में जल संतुलन का एक व्यवस्थित लेखा-जोखा है, जो आगतों (जैसे, वर्षा), निर्गमों (जैसे, वाष्पोत्सर्जन), और भंडारण में परिवर्तन (जैसे, मृदा नमी या भूजल) के बीच संबंध को दर्शाता है। यह द्रव्यमान संरक्षण के सिद्धांत का पालन करता है, जहाँ कुल अंतर्वाह में से कुल बहिर्वाह घटाने पर एक अवधि में भंडारण में परिवर्तन प्राप्त होता है। जल बजट को इस प्रकार व्यक्त किया जाता है:
कहाँ
4. जल बजट का योजनाबद्ध आरेख
5. जल बजट के घटक
जल बजट में कई प्रमुख घटक शामिल होते हैं, जिनमें से प्रत्येक जल विज्ञान चक्र में एक विशिष्ट भूमिका निभाता है:
- वर्षा (P) : वर्षा, हिमपात या ओलावृष्टि सहित प्राथमिक इनपुट, जिसे वर्षामापी यंत्रों का उपयोग करके मापा जाता है। यह किसी क्षेत्र में जल चक्र की शुरुआत करता है।
- अंतर्वाह (I) : बाह्य स्रोतों से प्रणाली में प्रवेश करने वाला जल, जैसे कि जलग्रहण क्षेत्र में बहने वाली नदियाँ या धाराएँ।
- वाष्पीकरण (E) : वह प्रक्रिया जिसमें सौर ऊर्जा द्वारा संचालित झीलों या मिट्टी जैसी खुली सतहों से पानी तरल से वाष्प में परिवर्तित होता है।
- वाष्पोत्सर्जन (T) : पौधों से रंध्रों के माध्यम से होने वाली जल हानि, जिसे गणना में अक्सर वाष्पोत्सर्जन के रूप में वाष्पीकरण के साथ जोड़ दिया जाता है।
- अपवाह (R) : अतिरिक्त जल जो सतह से बहकर धाराओं, नदियों या महासागरों में चला जाता है, जो मृदा संतृप्ति और ढलान से प्रभावित होता है।
- भंडारण में परिवर्तन (ΔS) : मृदा नमी, भूजल या सतही जलाशयों में रखे पानी में शुद्ध परिवर्तन, जो इनपुट और आउटपुट के बीच संतुलन को दर्शाता है।
6. जल बजट का महत्व और अनुप्रयोग
जल बजट जल उपलब्धता का आकलन करने, सिंचाई कार्यक्रम की योजना बनाने और सूखे या बाढ़ के प्रबंधन के लिए महत्वपूर्ण है। यह जलाशयों की डिज़ाइनिंग, भूजल पुनर्भरण की भविष्यवाणी और टिकाऊ कृषि पद्धतियों को सुनिश्चित करने में सहायक होता है। उदाहरण के लिए, शुष्क क्षेत्रों में, ऋणात्मक
7. जल संतुलन और बजट निर्धारण में चुनौतियाँ
चुनौतियों में आँकड़ों की कमी, खासकर दूरदराज के इलाकों में, और वर्षा की तीव्रता जैसे जलवायु कारकों की परिवर्तनशीलता शामिल है। वनस्पति आवरण में बदलाव और मानवीय गतिविधियों (जैसे, बांध निर्माण) के कारण प्राकृतिक प्रवाह में बदलाव के कारण वाष्पोत्सर्जन के अनुमान सटीक नहीं हो सकते हैं। इनसे निपटने के लिए उन्नत निगरानी प्रणालियों और जल बजट मॉडलों के नियमित अद्यतन की आवश्यकता है।
निष्कर्ष
जल संतुलन और जल बजट पृथ्वी के जल संसाधनों के प्रभावी प्रबंधन के लिए आधारभूत हैं। योजनाबद्ध आरेख वर्षा से लेकर भंडारण परिवर्तनों तक, इसके घटकों की गतिशील परस्पर क्रिया को स्पष्ट करता है। इन सिद्धांतों को समझकर और उन्हें लागू करके, हितधारक जल की कमी को कम कर सकते हैं, कृषि उत्पादकता बढ़ा सकते हैं, और जलवायु परिवर्तनशीलता के अनुकूल ढल सकते हैं, जिससे विविध पारिस्थितिक तंत्रों में जल उपयोग के लिए एक संतुलित दृष्टिकोण सुनिश्चित हो सके।
प्रश्न:-4
दिए गए डेटा का उपयोग करके 500 वर्ग किमी क्षेत्र से थिएसेन बहुभुज विधि का उपयोग करके औसत वर्षा की गणना करें:
- स्टेशन: 1, 2, 3, 4, 5
- वर्षा (मिमी): 105, 200, 415, 325, 310
- बहुभुज का क्षेत्रफल (किमी²): 75, 120, 100, 130, 75
उत्तर:
थिएसेन बहुभुज विधि का उपयोग करके औसत वर्षा की गणना करने के लिए, हमें संबंधित थिएसेन बहुभुजों के क्षेत्रफलों के आधार पर वर्षा मानों का भारित औसत ज्ञात करना होगा। थिएसेन बहुभुज विधि प्रत्येक वर्षामापी स्टेशन को उसके आसपास के बहुभुज के क्षेत्रफल के अनुपात में भार प्रदान करती है, जो उस स्टेशन की वर्षा के कुल क्षेत्रफल पर प्रभाव को दर्शाता है।
दिया गया डेटा:
- स्टेशन: 1, 2, 3, 4, 5
- वर्षा (मिमी): 105, 200, 415, 325, 310
- बहुभुज का क्षेत्रफल (किमी²): 75, 120, 100, 130, 75
- कुल क्षेत्रफल = 500 वर्ग किमी
चरण 1: भारित वर्षा की गणना करें
प्रत्येक स्टेशन के लिए भारित वर्षा की गणना प्रत्येक स्टेशन पर होने वाली वर्षा को उसके संगत थिएसेन बहुभुज के क्षेत्रफल से गुणा करके की जाती है। यह कुल क्षेत्रफल में प्रत्येक स्टेशन की वर्षा के योगदान को दर्शाता है।
- स्टेशन 1:
- स्टेशन 2:
- स्टेशन 3:
- स्टेशन 4:
- स्टेशन 5:
चरण 2: भारित वर्षा का योग करें
कुल भारित वर्षा प्राप्त करने के लिए भारित वर्षा मानों को जोड़ें:
चरण 3: औसत वर्षा की गणना करें
औसत वर्षा कुल भारित वर्षा को कुल क्षेत्रफल से विभाजित करके प्राप्त की जाती है:
अंतिम उत्तर
थिएसेन बहुभुज पद्धति का उपयोग करते हुए, 500 वर्ग किमी क्षेत्र में औसत वर्षा 277.75 मिमी है ।
प्रश्न:-5
कीटाणुशोधन को परिभाषित कीजिए। प्रवाह आरेख सहित पारंपरिक जल उपचार संयंत्र की व्याख्या कीजिए।
उत्तर:
1. कीटाणुशोधन का परिचय
जल उपचार में कीटाणुशोधन एक महत्वपूर्ण प्रक्रिया है जिसका उद्देश्य बैक्टीरिया, वायरस और प्रोटोज़ोआ जैसे रोगजनक सूक्ष्मजीवों को नष्ट या निष्क्रिय करना है ताकि यह सुनिश्चित किया जा सके कि जल मानव उपभोग और अन्य उपयोगों के लिए सुरक्षित है। यह जन स्वास्थ्य सुरक्षा में एक महत्वपूर्ण कदम है, जो हैजा और टाइफाइड जैसी जलजनित बीमारियों की रोकथाम करता है। कीटाणुशोधन रासायनिक विधियों (जैसे, क्लोरीनीकरण), भौतिक विधियों (जैसे, पराबैंगनी विकिरण), या दोनों के संयोजन से किया जा सकता है। यह व्यापक समाधान कीटाणुशोधन को विस्तार से परिभाषित करता है, पारंपरिक जल उपचार संयंत्र प्रक्रिया की रूपरेखा प्रस्तुत करता है, और उपचार के चरणों को दर्शाने के लिए एक प्रवाह आरेख भी शामिल करता है।
2. कीटाणुशोधन की परिभाषा और महत्व
कीटाणुशोधन का अर्थ है पानी में मौजूद रोग पैदा करने वाले सूक्ष्मजीवों को चुनिंदा रूप से नष्ट या निष्क्रिय करना, बिना यह ज़रूरी किए कि पानी को पूरी तरह से जीवाणुरहित कर दिया जाए, जिससे सभी सूक्ष्मजीव नष्ट हो जाएँगे। इसका लक्ष्य सूक्ष्मजीवों की मात्रा को स्वास्थ्य मानकों, जैसे कि विश्व स्वास्थ्य संगठन (WHO) या राष्ट्रीय दिशानिर्देशों द्वारा निर्धारित, द्वारा सुरक्षित माने जाने वाले स्तर तक कम करना है। यह ज़रूरी है क्योंकि प्राकृतिक स्रोतों से प्राप्त अनुपचारित पानी में अक्सर मानव या पशु अपशिष्ट से रोगाणु होते हैं। प्रभावी कीटाणुशोधन जल की गुणवत्ता को बेहतर बनाता है, जन स्वास्थ्य को बढ़ावा देता है, और कई क्षेत्रों में यह एक कानूनी आवश्यकता है, जिससे यह पेयजल आपूर्ति प्रणालियों का एक अनिवार्य हिस्सा बन गया है।
3. पारंपरिक जल उपचार संयंत्र का अवलोकन
एक पारंपरिक जल उपचार संयंत्र, आमतौर पर नदियों, झीलों या जलाशयों से प्राप्त कच्चे पानी से भौतिक, रासायनिक और जैविक संदूषकों को हटाने के लिए डिज़ाइन किया गया है। इस प्रक्रिया में कई चरण शामिल हैं: स्क्रीनिंग, जमावट, ऊर्णन, अवसादन, निस्पंदन और कीटाणुशोधन। प्रत्येक चरण विशिष्ट अशुद्धियों को लक्षित करता है, जिससे गंदे, दूषित पानी को स्वच्छ, सुरक्षित पेयजल में परिवर्तित किया जाता है। अपनी विश्वसनीयता और बड़ी मात्रा को संभालने की क्षमता के कारण, इस विधि का विश्व स्तर पर व्यापक रूप से उपयोग किया जाता है, हालाँकि इसके लिए महत्वपूर्ण बुनियादी ढाँचे और रखरखाव की आवश्यकता होती है। अंतिम कीटाणुशोधन चरण यह सुनिश्चित करता है कि वितरण के दौरान पानी रोगाणु मुक्त रहे।
4. पारंपरिक जल उपचार की विस्तृत प्रक्रिया
पारंपरिक जल उपचार प्रक्रिया स्क्रीनिंग से शुरू होती है , जहाँ छड़ियों और पत्तियों जैसे बड़े मलबे को बार स्क्रीन का उपयोग करके हटाया जाता है। इसके बाद जमावट होती है, जहाँ निलंबित कणों को अस्थिर करने के लिए रसायन (जैसे, फिटकरी) मिलाए जाते हैं, जिससे सूक्ष्म फ्लोक बनते हैं। फ्लोक्यूलेशन में , हल्का मिश्रण इन कणों को बड़े फ्लोक में एकत्रित होने के लिए प्रोत्साहित करता है। अवसादन , अवसादन टैंकों में गुरुत्वाकर्षण द्वारा फ्लोक को पानी से बाहर निकलने देता है। फिर निस्पंदन द्वारा रेत या मल्टीमीडिया फिल्टर का उपयोग करके शेष कणों को हटा दिया जाता है। अंत में, कीटाणुशोधन (जैसे, क्लोरीन या ओजोन के साथ) रोगजनकों को मारता या निष्क्रिय करता है। उपचारित जल को संग्रहीत और वितरित किया जाता है, और अवशिष्ट कीटाणुनाशकों से सुरक्षा सुनिश्चित की जाती है।
5. पारंपरिक जल उपचार संयंत्र का प्रवाह आरेख
6. जल उपचार में कीटाणुशोधन के प्रकार
कीटाणुशोधन विधियाँ तकनीक और अनुप्रयोग के आधार पर भिन्न होती हैं। क्लोरीनीकरण में रोगजनकों को मारने के लिए क्लोरीन गैस या यौगिकों का उपयोग किया जाता है, जिससे अवशिष्ट प्रभाव तो रह जाता है, लेकिन इससे कीटाणुशोधन उप-उत्पाद भी बन सकते हैं। ओजोनीकरण में सूक्ष्मजीवों को शीघ्र नष्ट करने के लिए ओजोन गैस का उपयोग किया जाता है, लेकिन इसमें अवशिष्ट सुरक्षा का अभाव होता है। पराबैंगनी (यूवी) विकिरण सूक्ष्मजीवों के डीएनए को नष्ट कर देता है, जो साफ पानी के लिए प्रभावी है, लेकिन इसके लिए पूर्व-फ़िल्टरिंग की आवश्यकता होती है। क्लोरीन डाइऑक्साइड और विद्युत-रासायनिक कीटाणुशोधन ऐसे विकल्प हैं जिनके विशिष्ट लाभ हैं, जैसे कि उप-उत्पादों का कम निर्माण। चुनाव जल की गुणवत्ता, लागत और नियामक आवश्यकताओं पर निर्भर करता है।
7. कीटाणुशोधन में चुनौतियाँ और विचार
चुनौतियों में रोगाणुओं का पूर्ण निष्कासन सुनिश्चित करना, रासायनिक अवशेषों का प्रबंधन और प्रतिरोधी सूक्ष्मजीवों से निपटना शामिल है। कीटाणुनाशकों की अधिक खुराक से ट्राइहैलोमीथेन जैसे हानिकारक उपोत्पाद उत्पन्न हो सकते हैं, जबकि कम खुराक से रोग फैलने का खतरा होता है। नियमित निगरानी, उचित खुराक और उन्नत उपचार (जैसे, सक्रिय कार्बन) आवश्यक हैं। इसके अतिरिक्त, पुराने बुनियादी ढाँचे और बिजली की रुकावटें उपचार की दक्षता को प्रभावित कर सकती हैं, जिसके लिए मज़बूत रखरखाव और बैकअप प्रणालियों की आवश्यकता होती है।
निष्कर्ष
जल उपचार में कीटाणुशोधन एक महत्वपूर्ण सुरक्षा उपाय है, जो सार्वजनिक उपयोग के लिए रोगाणु-मुक्त जल सुनिश्चित करता है। पारंपरिक जल उपचार संयंत्र, अपनी बहु-चरणीय प्रक्रिया और प्रवाह आरेख के साथ, जल शोधन के लिए एक संरचित दृष्टिकोण का उदाहरण प्रस्तुत करता है। चुनौतियों का समाधान करके और कीटाणुशोधन विधियों को अनुकूलित करके, जल उपचार संयंत्र सुरक्षित पेयजल की बढ़ती माँग को प्रभावी ढंग से पूरा कर सकते हैं, और दुनिया भर के समुदायों में स्वास्थ्य और स्थिरता को बढ़ावा दे सकते हैं।